
|
A system that provides the main statistical data provided by the national government and private companies in graphs.
|
List of countries
List of Prefectures
List of Prefectures
List of cities
- A-E
- F-J
- K-O
- P-T
- U-Z
About this Site
A system that provides major statistics data from such as the state and private enterprise, and processes this data to display it in charts or similar representation so that it can be easily viewed and is in a form that can be easily used.
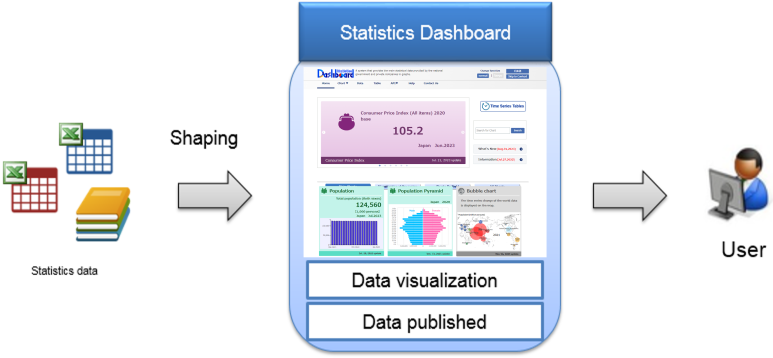
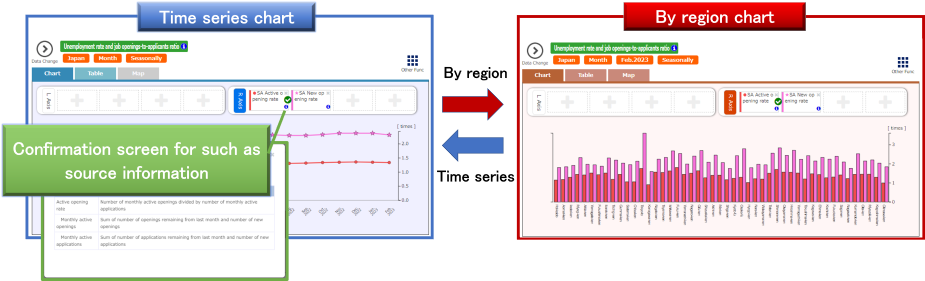
Frequently used statistics data is first displayed in a chart. This allows you to quickly compare differences based on data over time (time series) and the region.
You can also view the statistical survey name used for the data source and explanations for items in the chart.
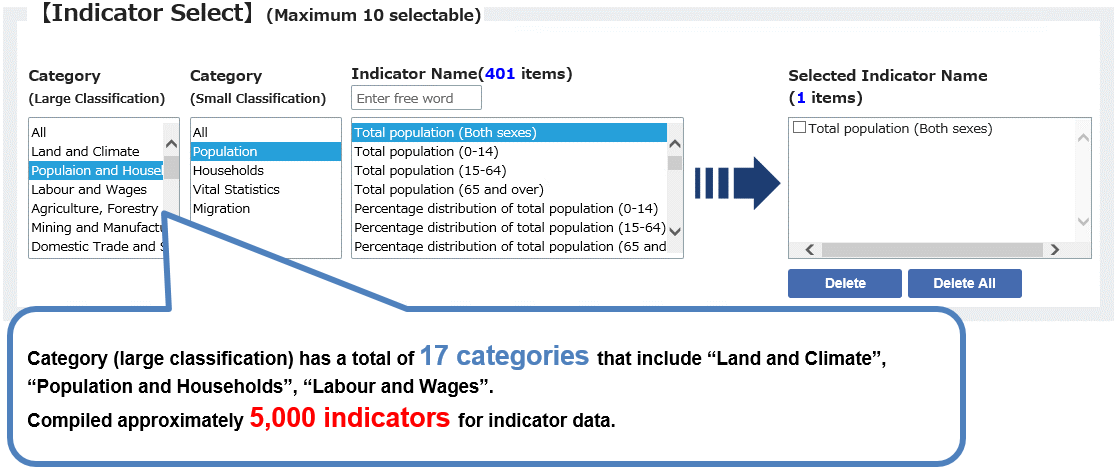
Also, we have compiled approximately 6,000 data indicators and organized them by each category.
Therefore, you can easily search by selecting the indicator name in the data you want to search from the category, even if you do not know the agency that performed the statistical survey or the statistical survey name.
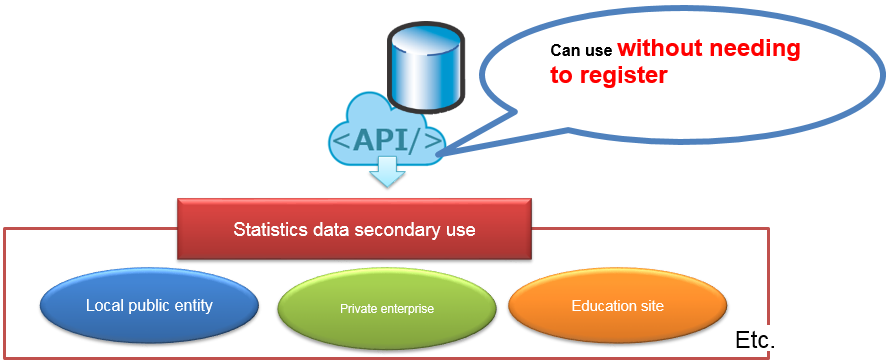
As you can see, not only is it equipped with a large number of functions that anyone can use statistics freely, it is a system you can use extensively because you can use the statistics API for all compiled data and it is convenient even when using large amounts of data regularly.
Please refer to "Things you can do on this website" if you want to know more details.
About the provided data list
Please refer to "Provided_data_list" for the data list provided by Statistics Dashboard.