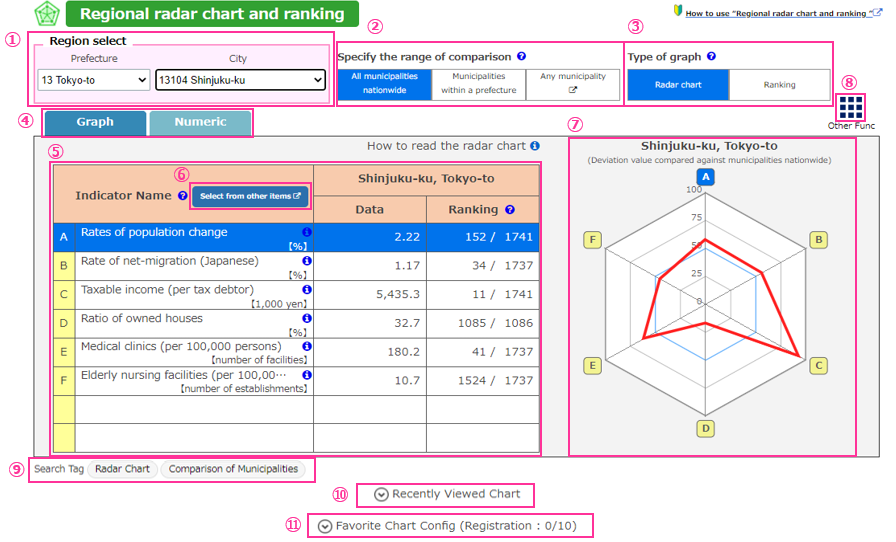
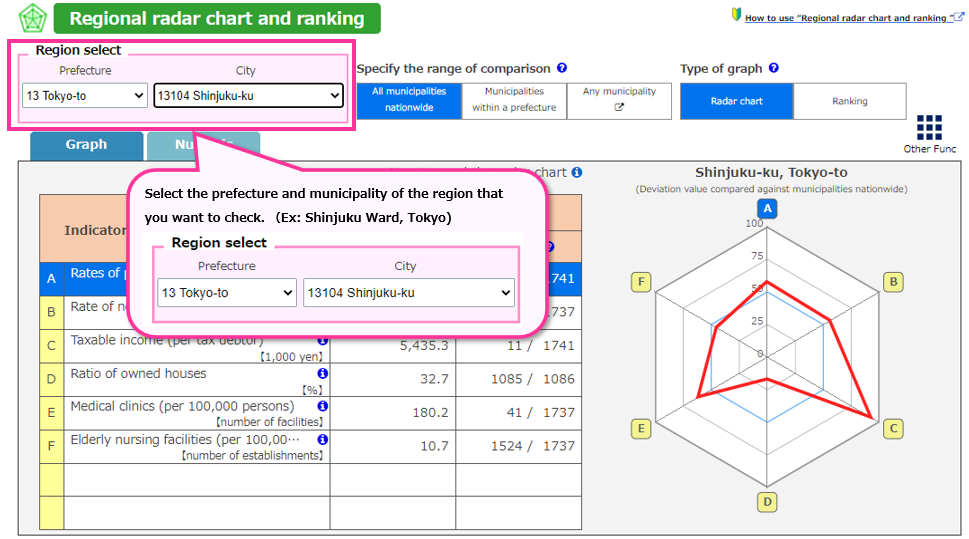
▼ ① Region selection field
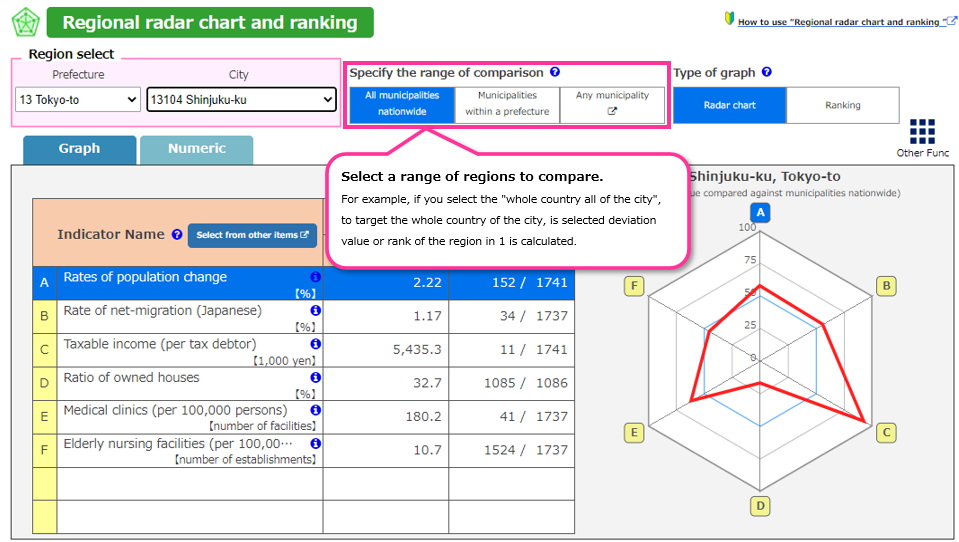
Select the region (prefecture and municipality) that you want to check.
If you select a prefecture such as "13000 Tokyo" in the municipality field, the deviation value and rank will be calculated
against all 47 prefectures nationwide.
▼ ② “Range of comparison” switching buttons
Select the range (region) for comparison. For example, if you select "Municipalities nationwide," the deviation value and rank of
the region selected in ① will be calculated against cities, towns, villages, etc. across the entire country.
| All prefectures nationwide |
Calculate the deviation value and rank of the region selected in "① Region selection field"
against municipalities nationwide.
|
Municipalities within a
prefecture |
Calculate the deviation value or rank of the region selected in "① Region selection field" against
municipalities within the prefecture.
|
| Any municipality |
The user can select any municipality. The deviation value and rank of the region selected in ①
will be calculated against the selected municipalities.
|
If you select a prefecture such as "13000 Tokyo" in "① Region selection field," only "All prefectures nationwide" can be selected.

Also, if only some municipalities throughout the country are represented, such as data representing only the
cities where prefectural offices are located, the deviation value or rank within those will be calculated.
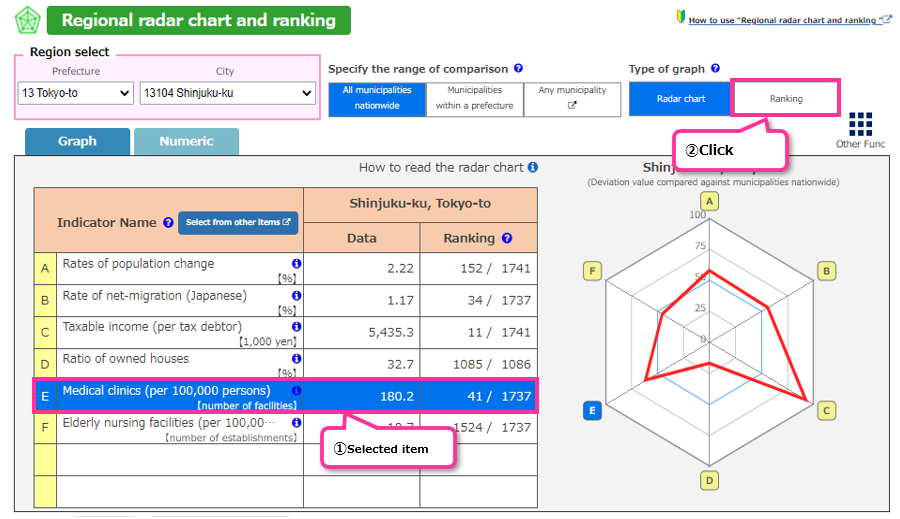
▼ ③ “Type of graph” switching buttons
You can switch between the radar chart and ranking display screen.
▼ ④ Graph/numeric switching tab
You can switch the content displayed on the screen.
▼ ⑤ Data display area
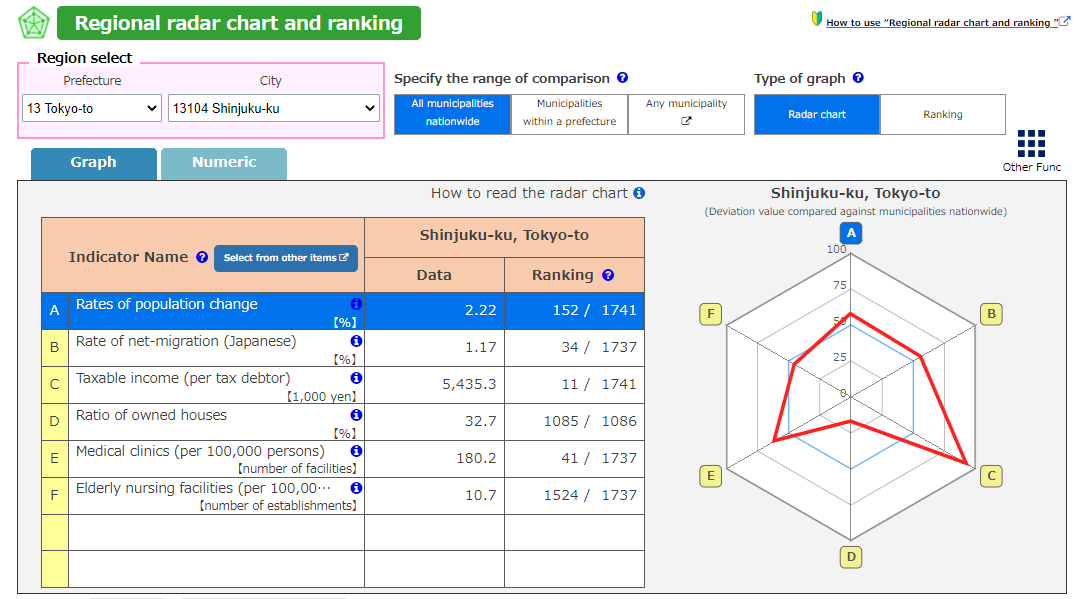
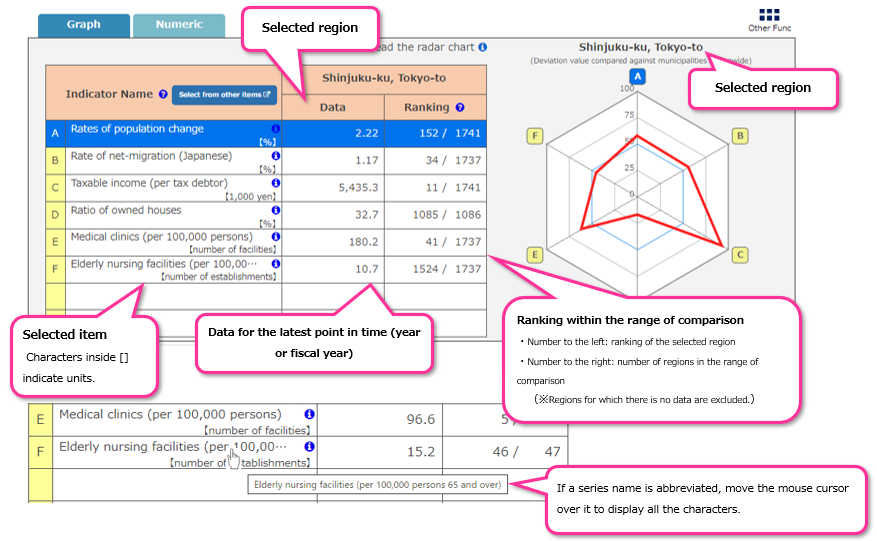
The item names are displayed along with the data and rank for the region selected in “① Region selection field.”
| Indicator Name |
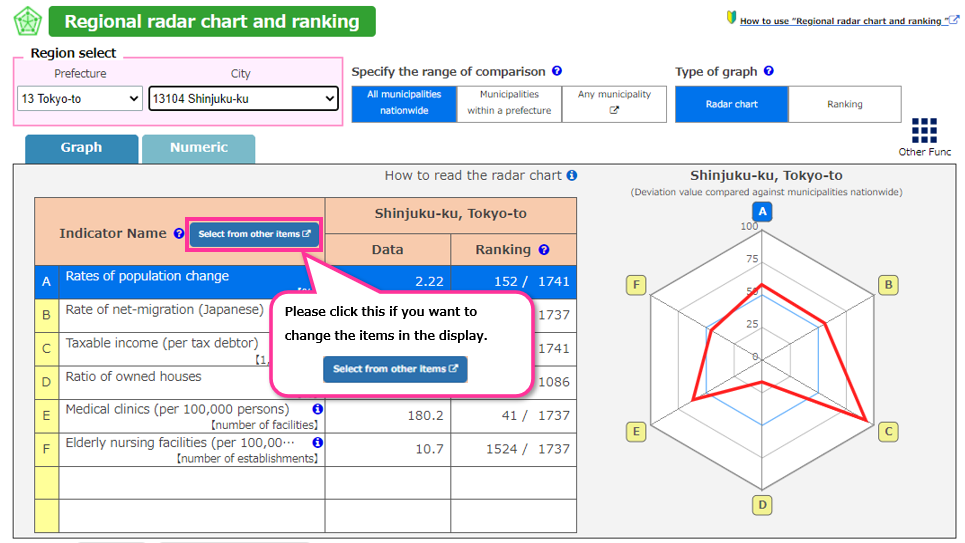
The currently selected items are displayed. Click “⑥ “Select from other items” button” to display the item selection menu and
change the items.The letters starting from “A” displayed to the left of the item names correspond to the letters starting from “A”
in "⑦ Graph display area." Characters inside [] indicate units.
|
| Data |
The data for the region selected in "① Region selection field" is displayed.
|
| Ranking |
Represents the rank within the range of comparison based on the size of the data.The number on the right indicates the number
of regions (excluding regions for which there is no data).
|
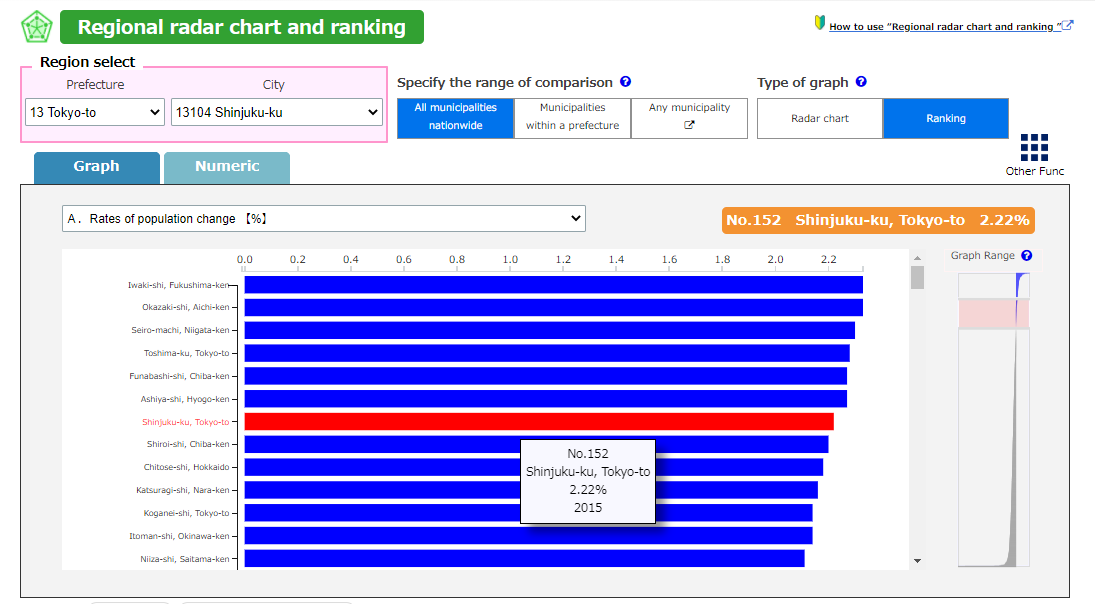
If you click "Ranking" in "③ "Type of graph" switching buttons," the ranking screen for the selected item will be displayed.
▼ ⑥ “Select from other items” button
This is used when you want to change the displayed items. Click to display the
item selection menu.
▼ ⑨ Search Tag
Tags are associated with each graph screen You can search for graph screens that correspond to the same tags. Please use this
function when you want to display related graphs.
▼ ⑩ Recently Viewed Chart
Displays mini-graphs of the most recently displayed graph screens. (The default state is collapsed.)
The history of up to 10 graphs is saved. Clicking the mini-graph displays the corresponding graph screen. Please use this function
when you want to return to a previously displayed graph.
▼ ⑪ Favorite Chart Config
Display the registered graph settings by clicking the "Favorite" button in "8 Other functions". (The default state is collapsed.)
Up to 10 graphs are saved. Clicking the mini-graph displays the corresponding graph screen.
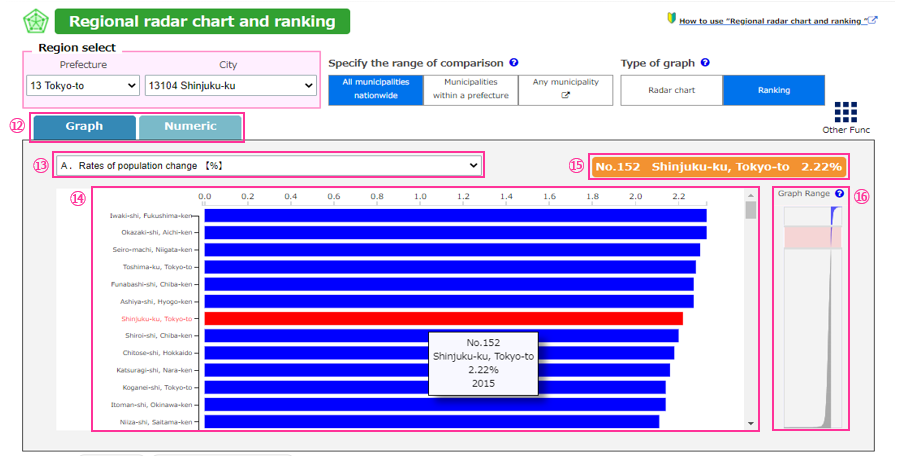
▼ ⑫ Graph/numeric switching tab
You can switch the content displayed on the screen.
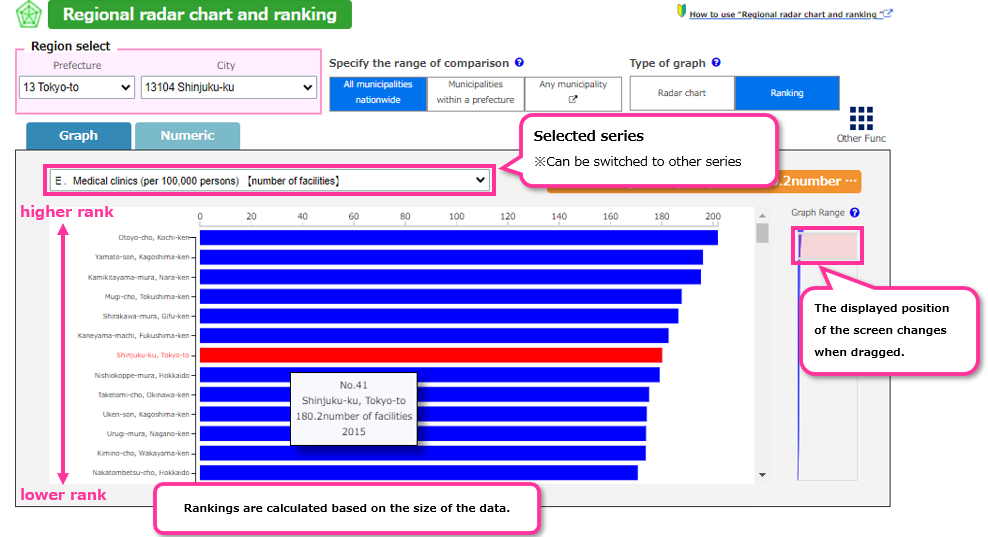
▼ ⑬ Item switching menu
You can switch the item for which rankings are displayed.The items that can be switched are the items currently selected on the
radar chart display screen.
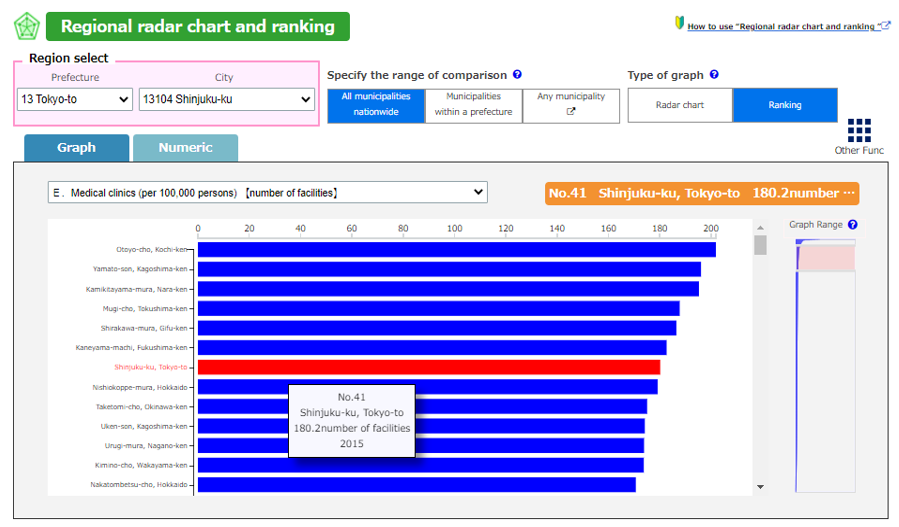
▼ ⑭ Graph display area
For the item selected in “⑬ Item switching menu,” the regions are ranked based on the size of the data and displayed in descending
order. When you move the cursor over the graph, it displays the ranking and data for the region along with the point in time.
▼ ⑮ Data display for selected region
Displays the rank and data for the region selected in the region selection field.
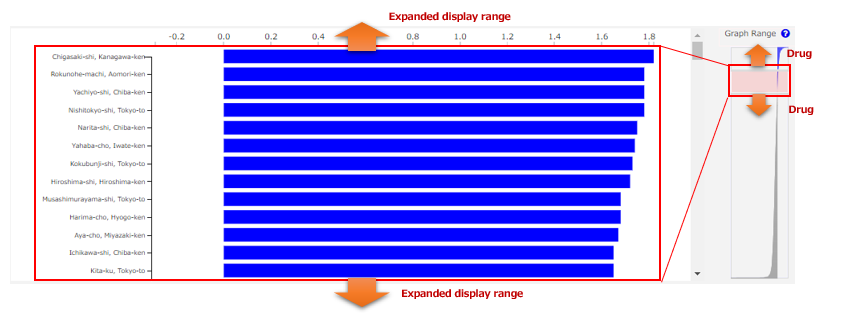
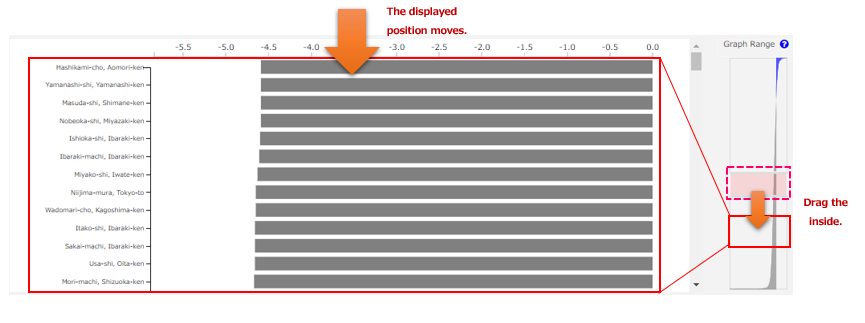
▼ ⑯ Graph range adjustment slider
You can change the displayed range of the graph in "⑭ Graph display area".
The pink area represents the currently displayed range. You can change the size of the displayed range by dragging the bars at
the top and bottom.
In addition, by dragging the inside of the pink area, you can move the displayed position
▼ Operating procedure
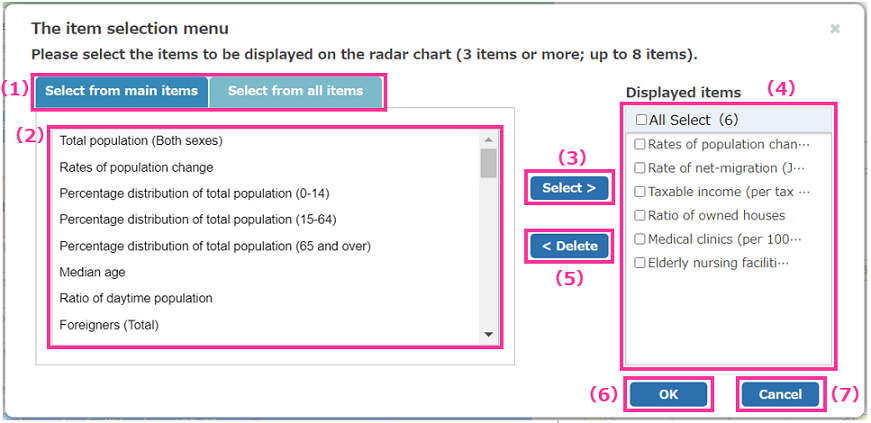
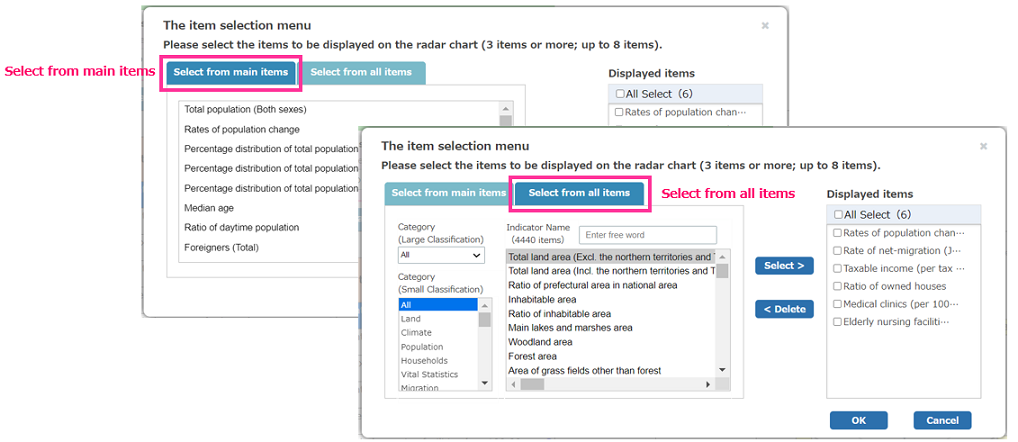
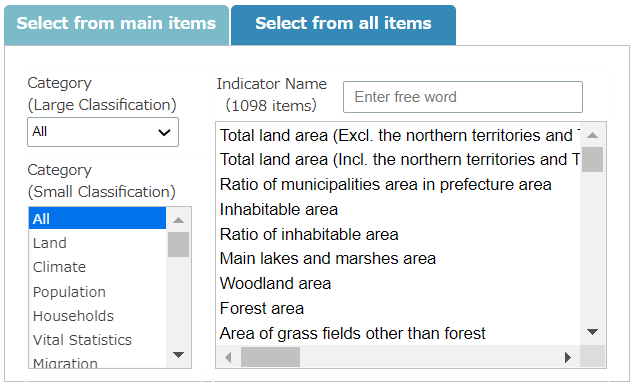
(1)Items to be displayed on the radar chart can be selected from among "Main items" or "All items."
(2) If you click the "Select from main items" tab, main items prepared in advance will be displayed in the list.
If you click the "Select from all items" tab, you can search for items by freely inputting fields (major and minor categories) and
item names.
(3) Select an item and click the "Select" button to add it to the list of selected item names on the right.
(4) The currently selected items are displayed. Up to 8 items can be displayed on the radar chart, and 3 or more items must
be selected.
(5) If you want to delete any of the selected items, add a check mark to the item(s) that you want to delete from the list on the
right, and click the "Delete" button.
(6) Click the "OK" button to return to the radar chart display screen and display the selected items.
(7) Click the "Cancel" button to cancel item selection and return to the radar chart display screen.
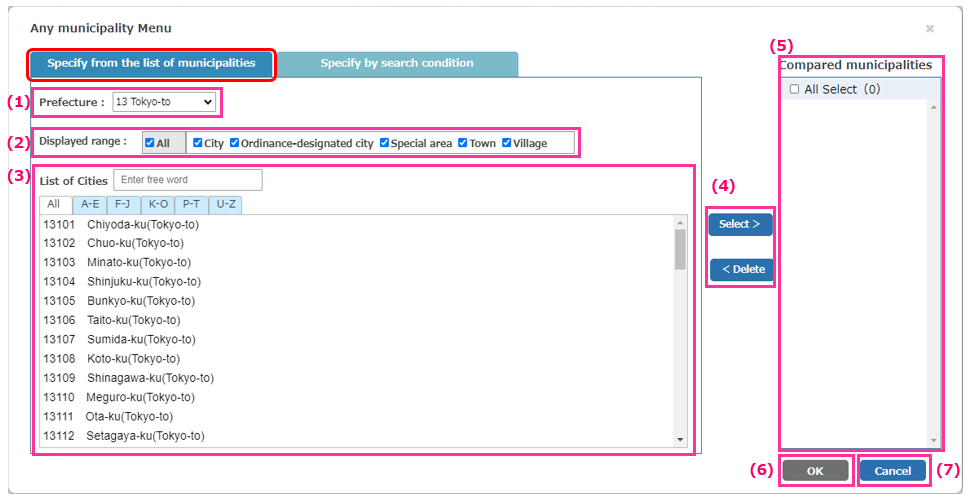
You can freely select the municipalities you want to use for comparison.Please use this function when you want to compare with
a specific area, such as within the 23 special wards of Tokyo or similar municipalities.The regions displayed in the municipality list
are cities, towns, villages, and special wards of Tokyo.
▼ Operating procedure
You can select cities, towns, and villages from the list of municipalities.
(1) Select the prefecture for which you want to display a list of cities, towns, and villages. If you want to display municipalities
throughout the country, select "00 Nationwide."
(2) You can narrow down the display range (regional level). Please add a check mark to the area level that you want to narrow down.
(3) Municipalities are displayed in the order of prefecture number and alphabetically. Please select the municipalities that you want to
use for comparison.
(4) After selecting municipalities in (3), click the "Select" button. They will be added to the selected municipalities in (5).
(5) The currently selected municipalities are displayed. If you want to delete any of them, add a check mark and click the "Delete"
button in (4).
(6) Click the "OK" button to return to the original screen and update the graph and data.
(7) Click the "Cancel" button to cancel municipality selection and return to the original screen.
▼ Operating procedure
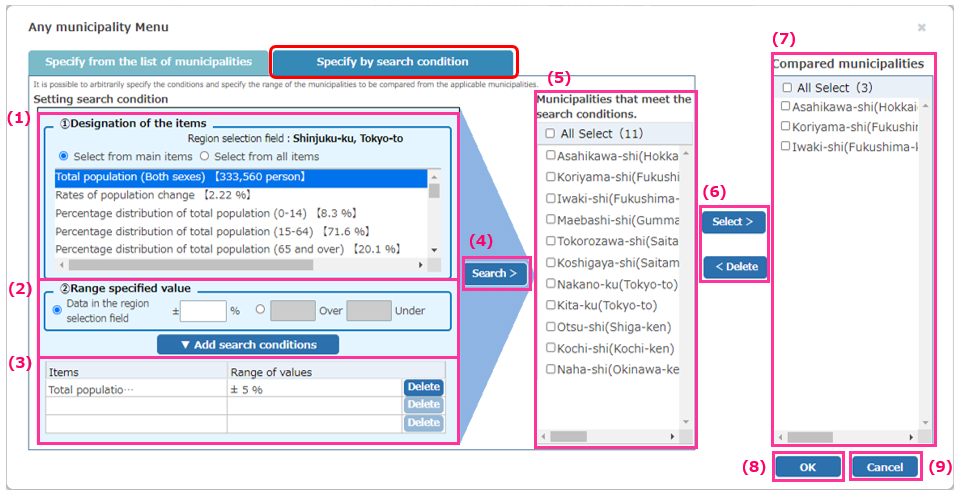
You can specify search conditions and select the municipalities you want to use for comparison from among the municipalities that
correspond to them.
(1) Items and data for the municipality selected in “① Region selection field” are displayed. Please select an item you want to use as
a search condition.
The list can be displayed in two ways: "(prepopulated) main items" and "all items".
(2) Please specify the range of values to be set for the search condition. After specifying, click the "Add search condition" button.
(3) The specified search conditions are displayed. Up to 3 search conditions can be specified. If multiple conditions are specified,
the search will be performed using the AND condition. (If you want to delete any of the search conditions, click the "Delete"
button to the right.)
(4) When you are done specifying search conditions, click the "Search>" button
(5) Municipalities that meet the search conditions are displayed. Select the municipalities that you want to use for comparison.
(6) If you click the "Select" button, the municipalities selected in (5) will be added to the list of compared municipalities in (7).
(7) The selected municipalities are displayed. If you want to delete any of them, add a check mark to the left side and click the
"Delete" button (6).
(8) Click the "OK" button to return to the previous display and update the graph and data.
(9) Click the "Cancel" button to cancel the selection of municipalities and return to the previous display.


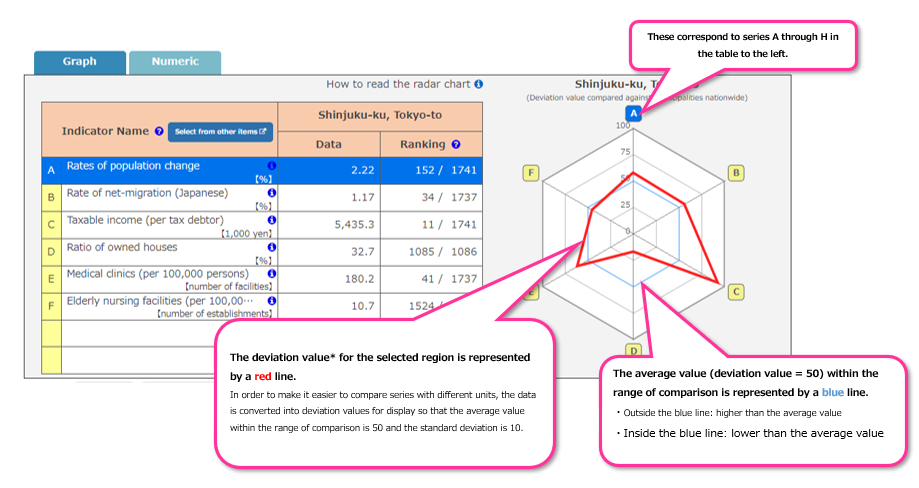



values (values converted so that the average value within the range of comparison is 50 and the standard deviation is 10).