
|
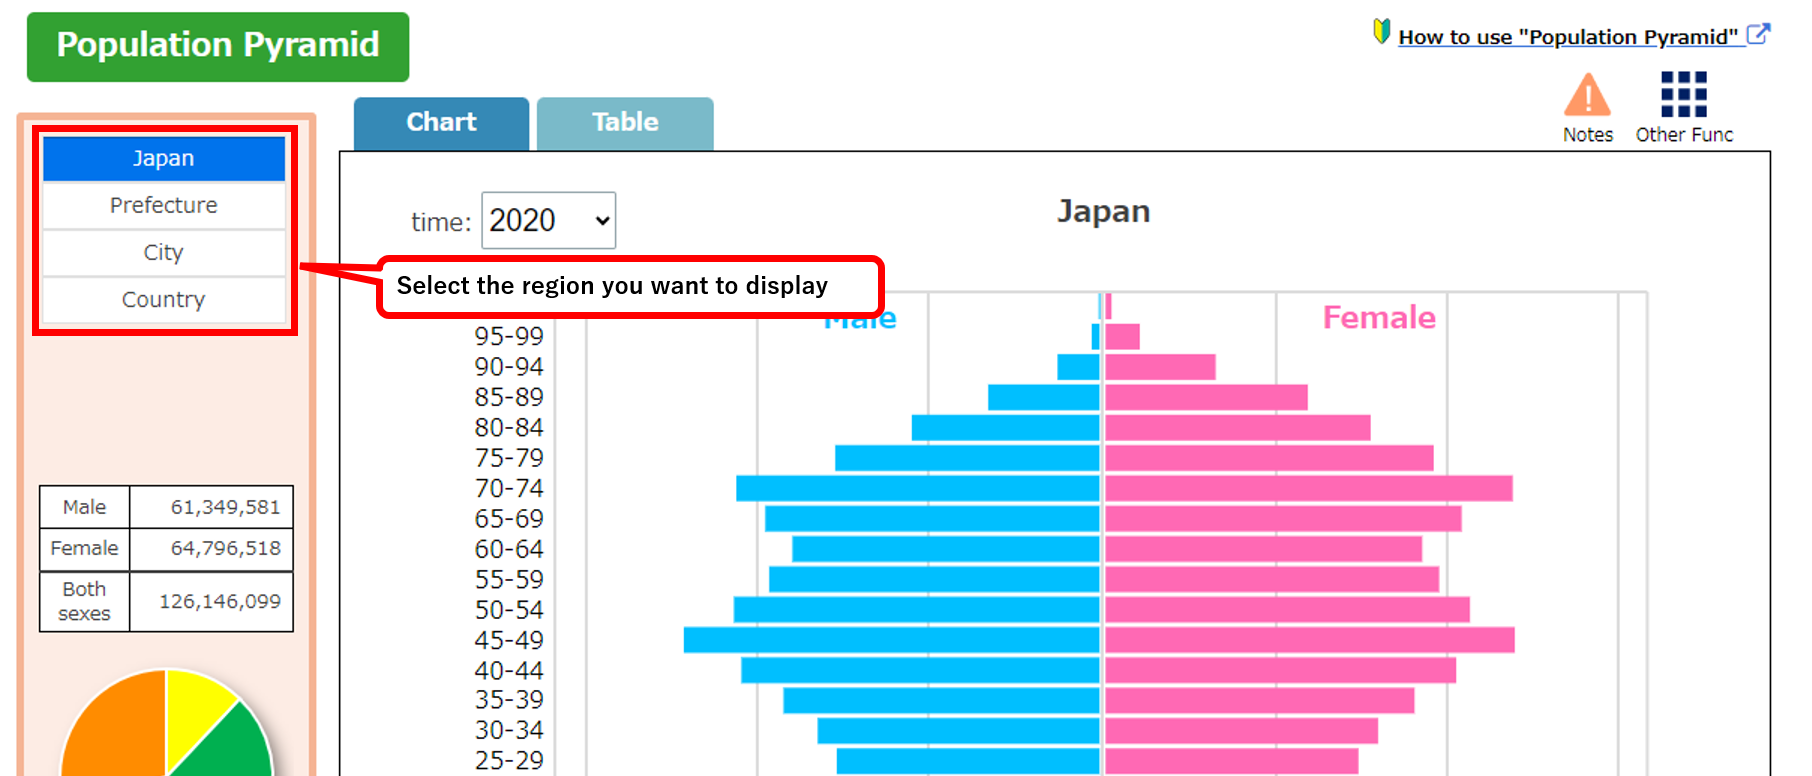
A system that provides the main statistical data provided by the national government and private companies in graphs.
|
List of countries
List of Prefectures
List of Prefectures
List of cities
- A-E
- F-J
- K-O
- P-T
- U-Z
How to use "Population Pyramid"
- 1. Select the region
-
When “Japan” is selected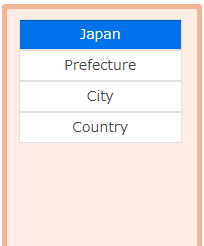
When “Prefecture” is selected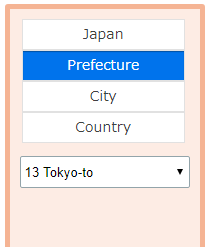
When “City” is selected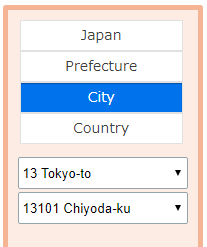
When “Country” is selected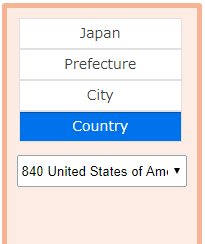
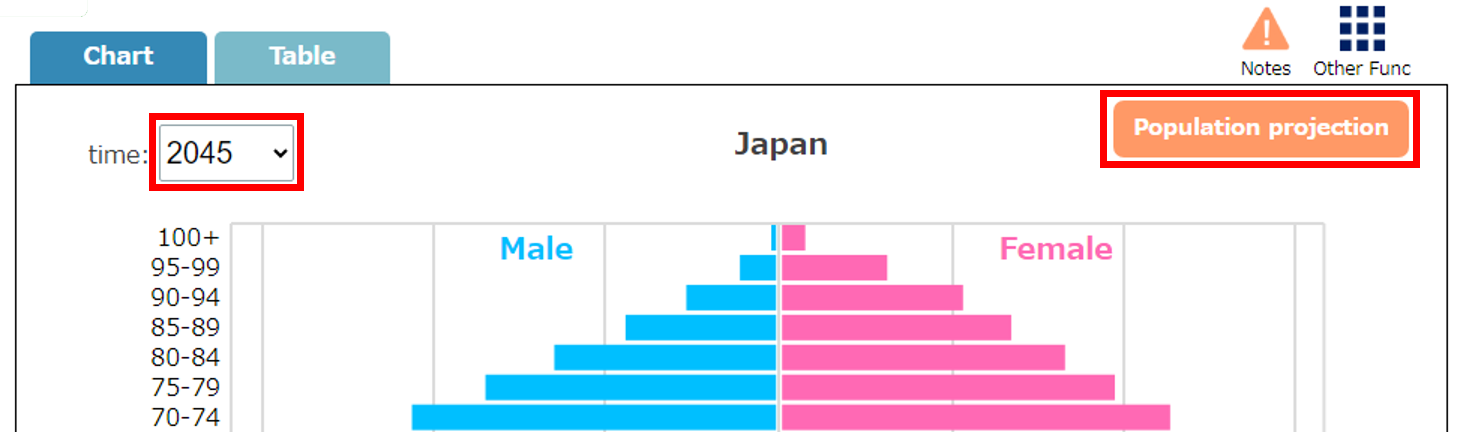
- 2. Select the time (year)
-
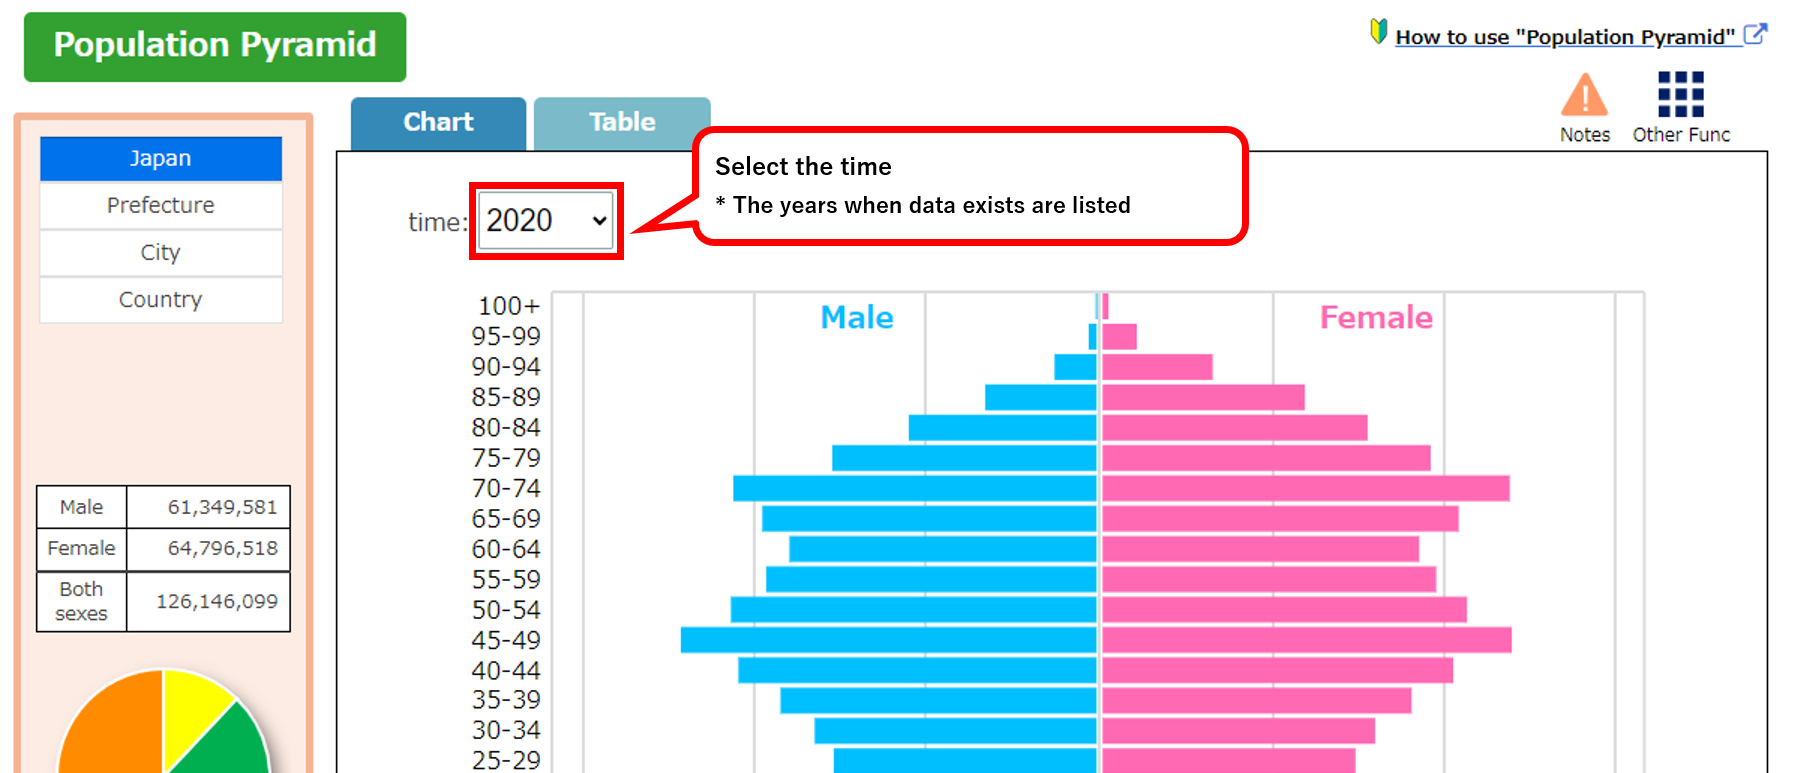
If a future time is selected, “Population projection” is displayed in the upper right.
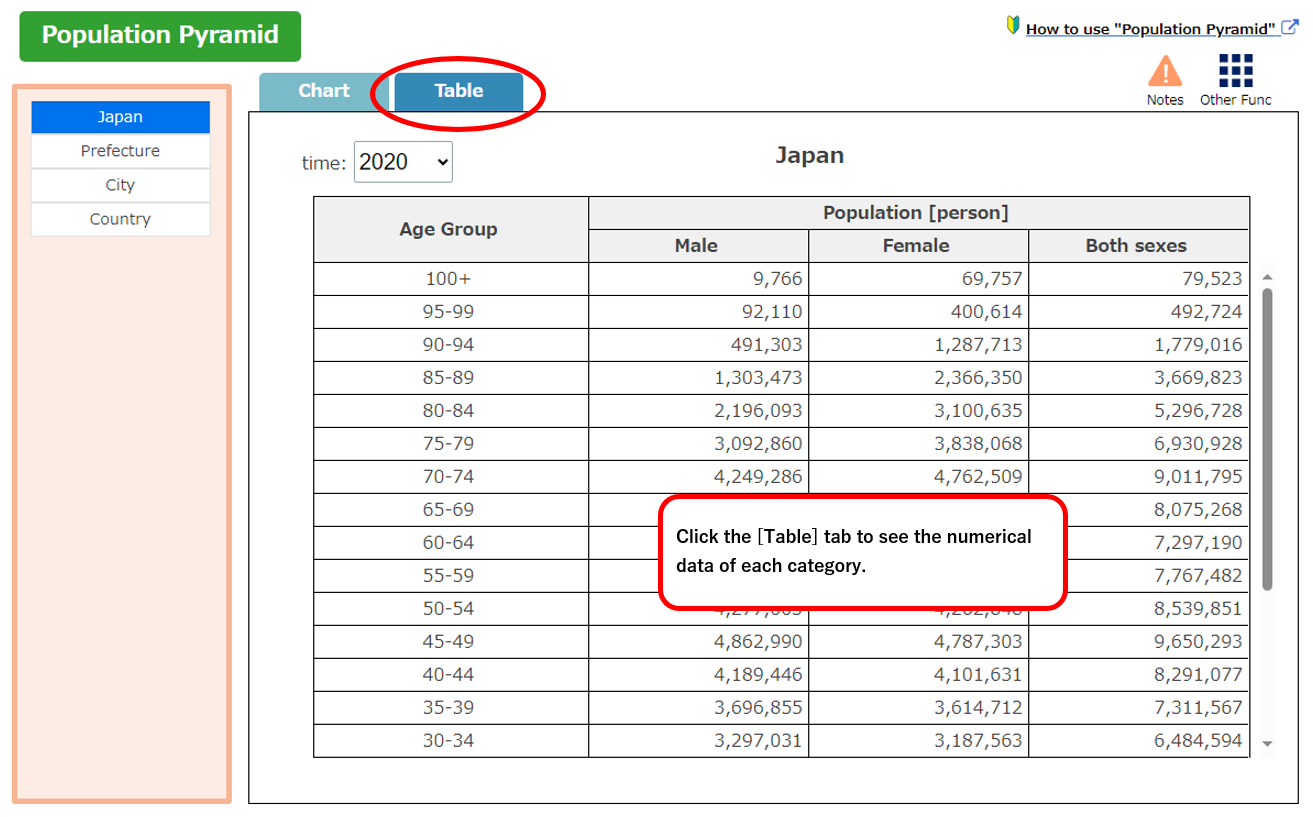
- 3. About the display of the population pyramid
-
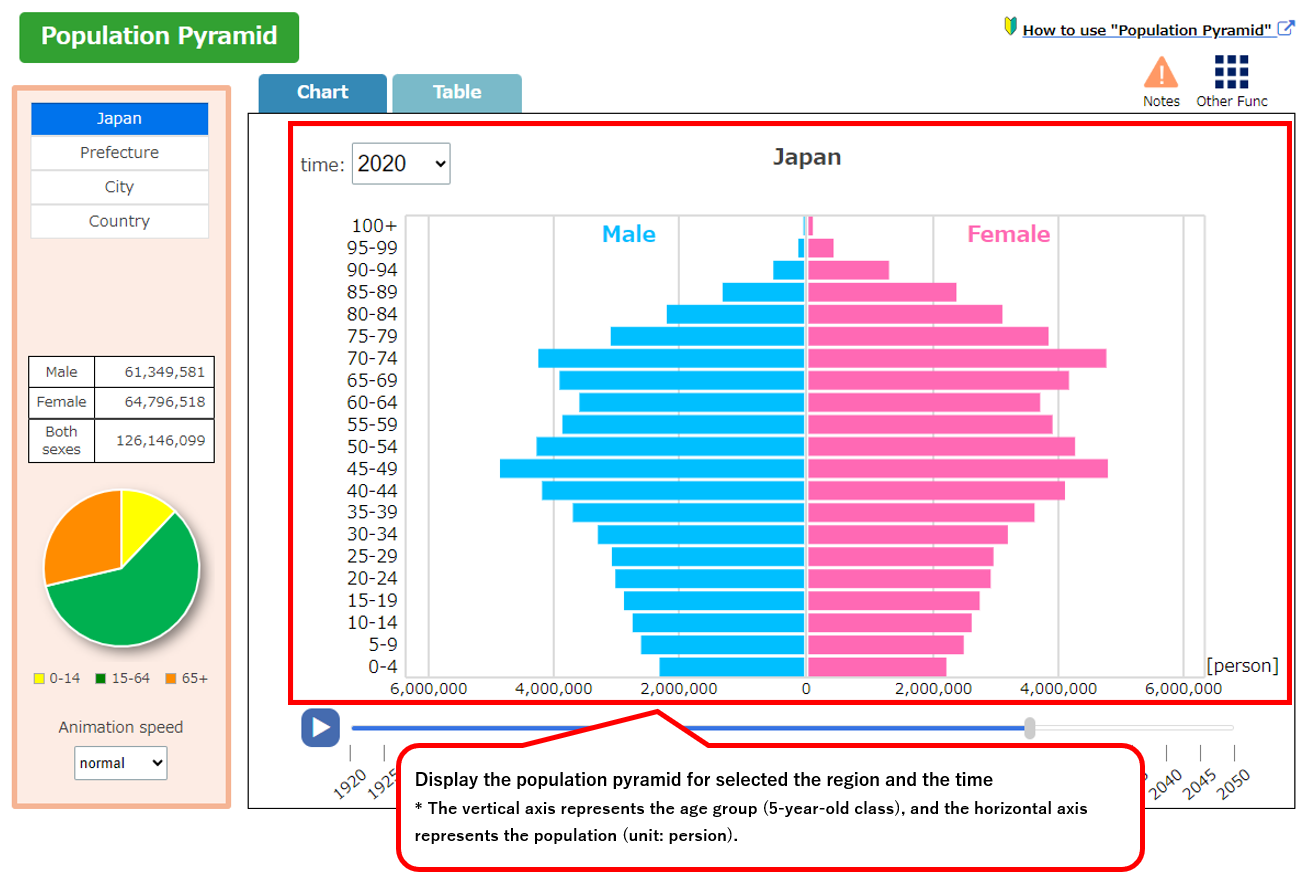
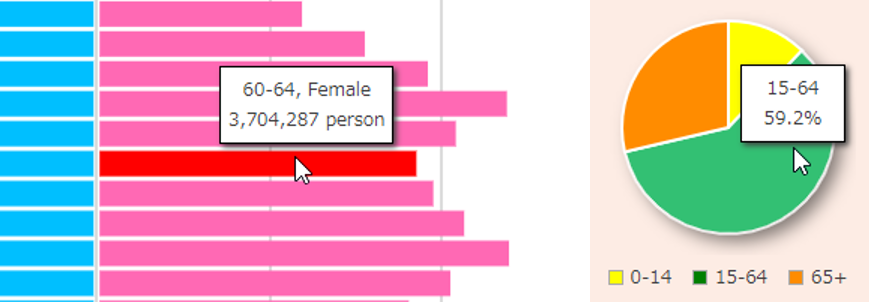
When you place the cursor on the graph, the data for that category is displayed.
- 4. Check the changes in the population pyramid with animation
-
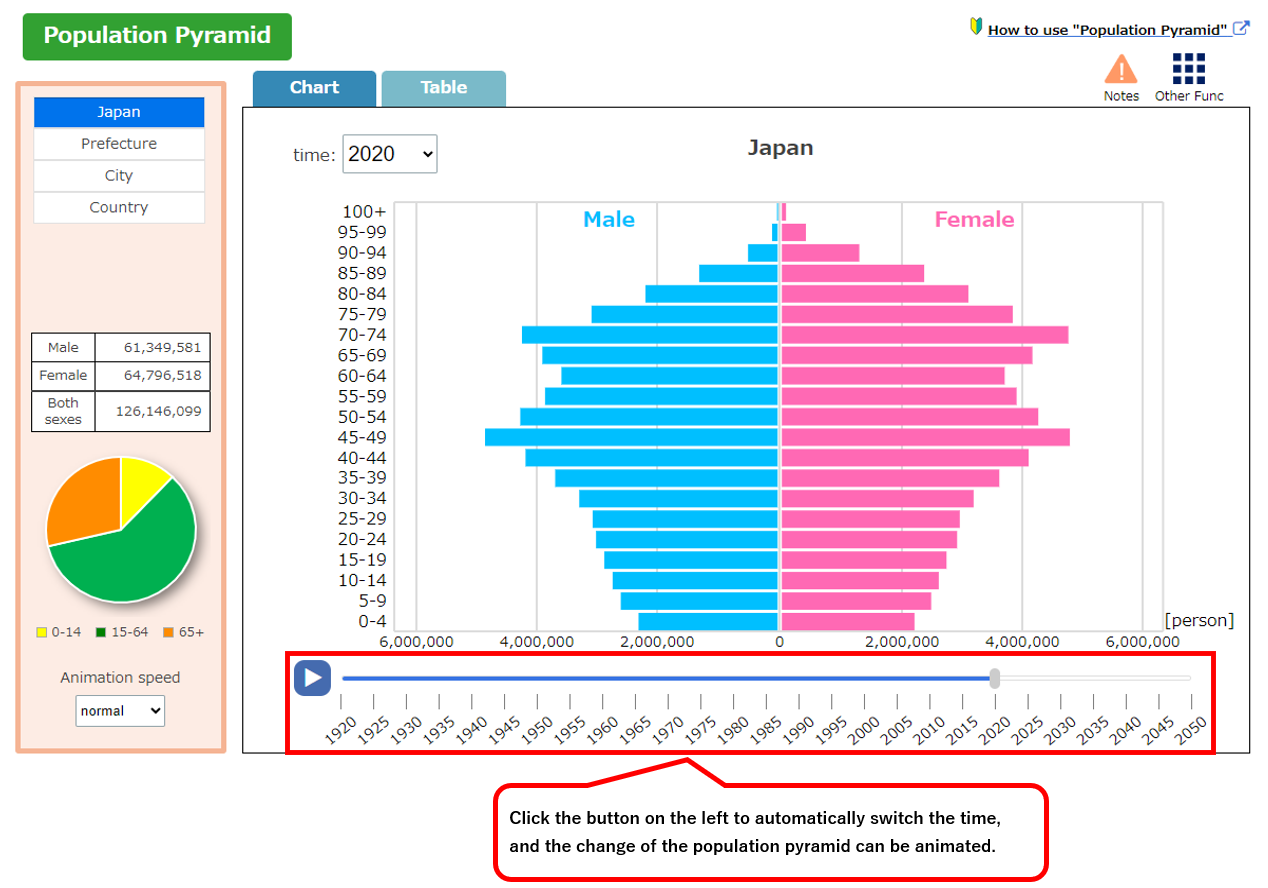
The animation speed can be specified from 3 levels.

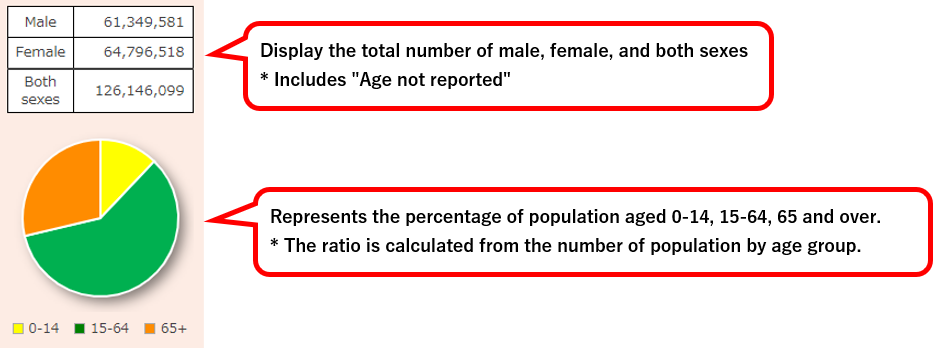
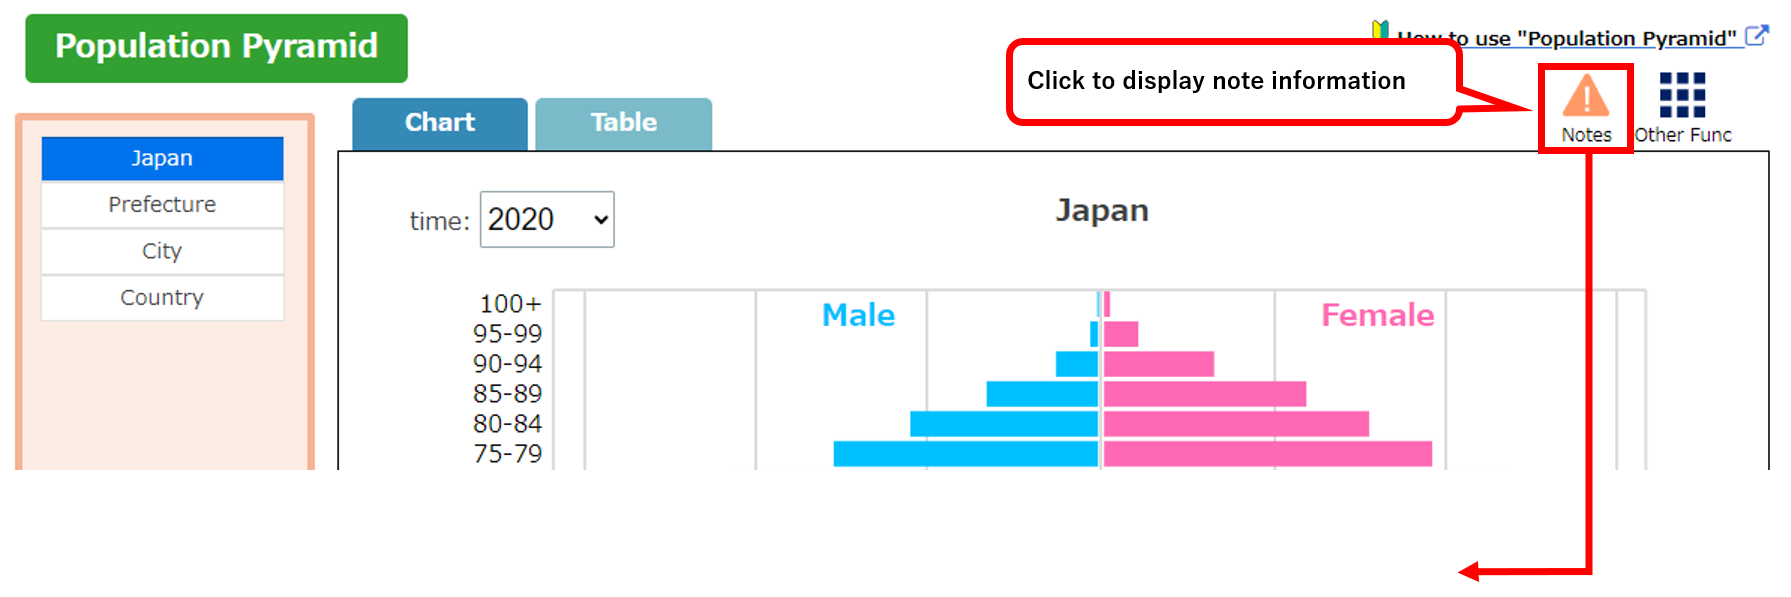
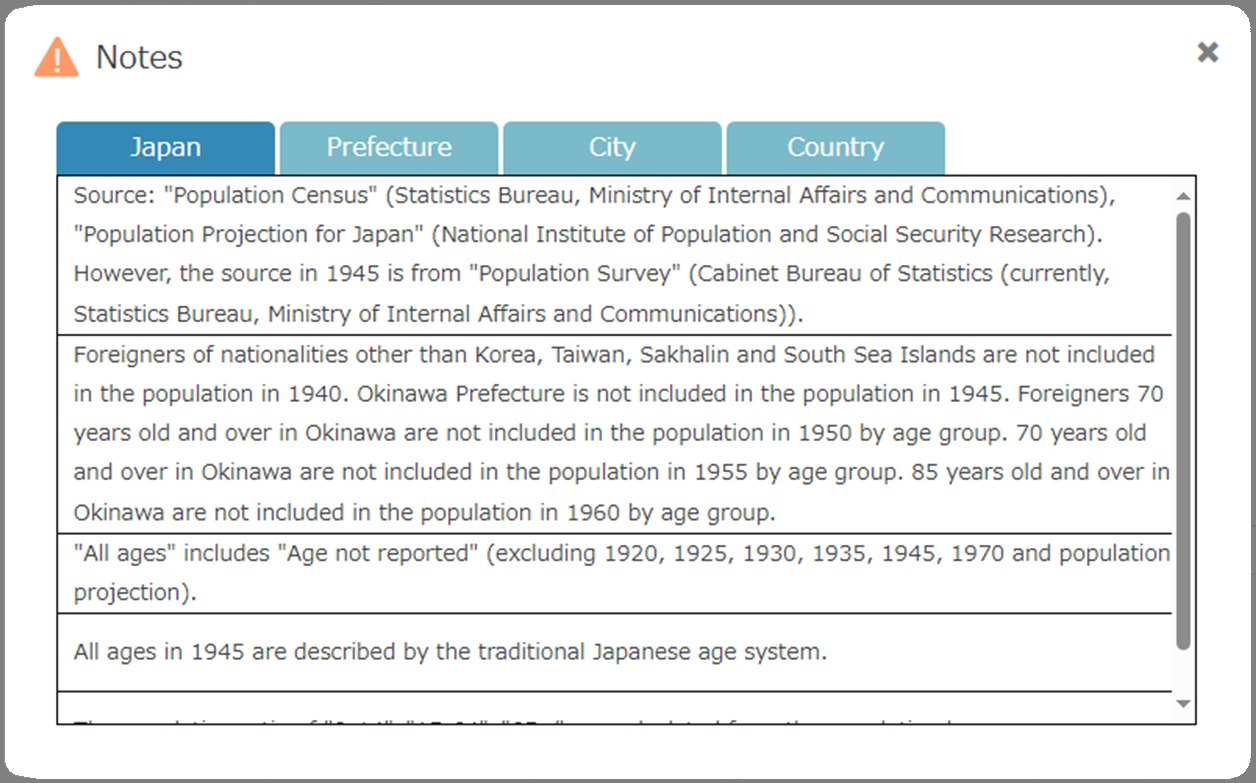
- 5. Display note information
-
- 6. Other functions
-
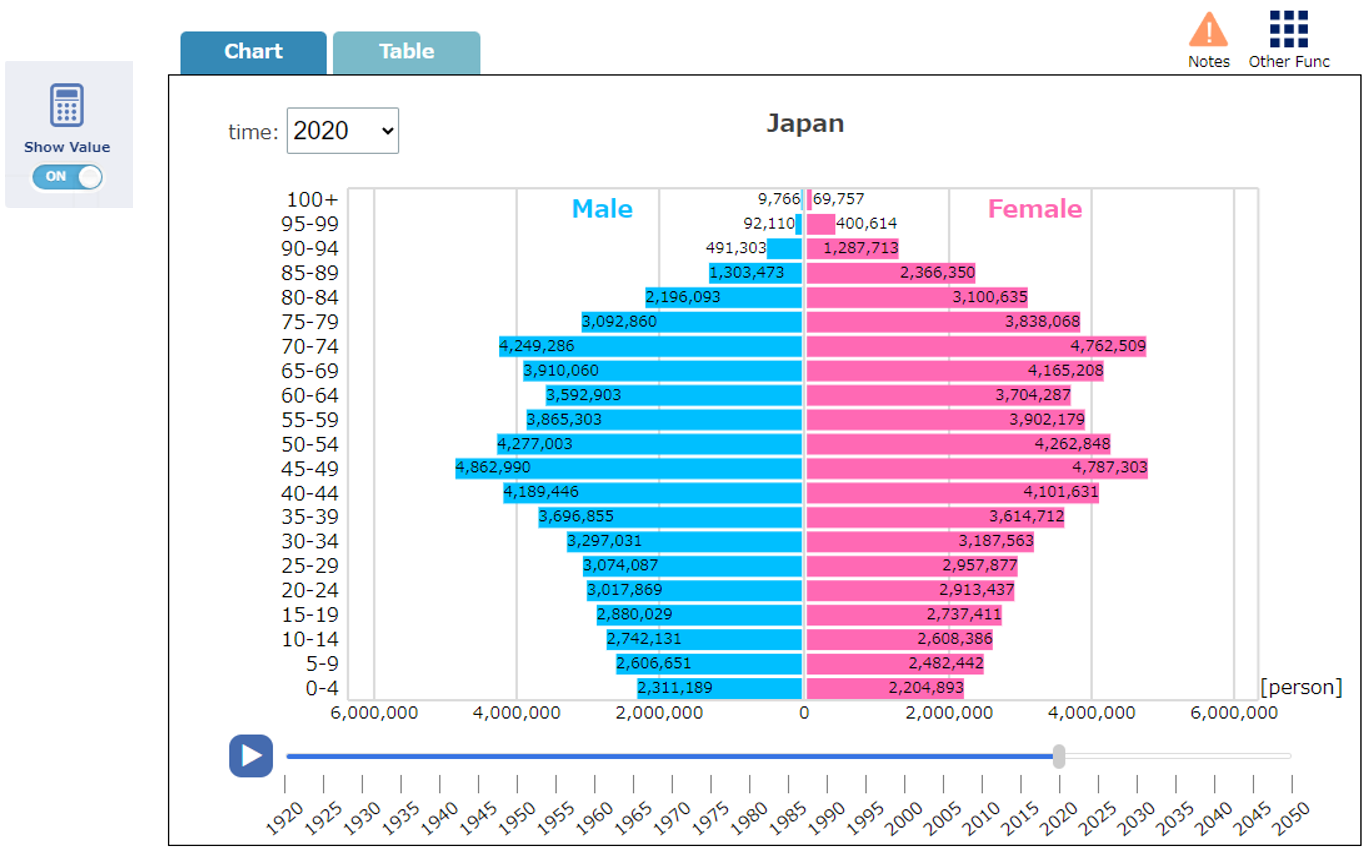
Other functions include "Show Value" and "Download".
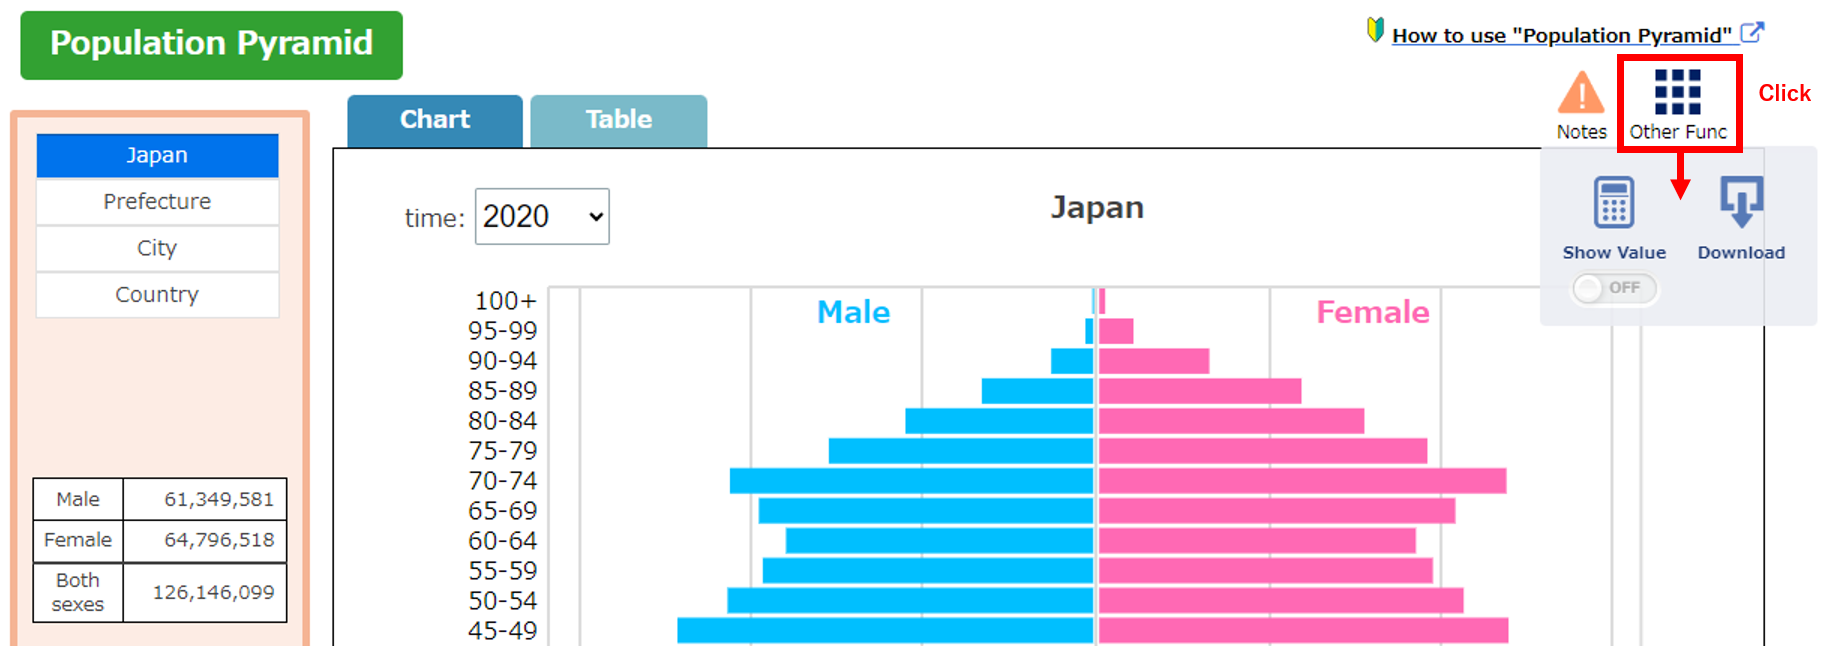
When "Show Value" is set to "ON", numerical data is displayed in the population pyramid.
Click "Download" to download the population pyramid data in CSV format.